A common task in performance analysis is identifying which code sections consume the most CPU time. This often requires profiling stack traces. Enter Flame graphs – a game-changer in how we visualize these profiles. They provide an intuitive visual representation of the application’s most CPU-intensive parts. In this article, we’ll take a look at how to generate these flame graphs using perf.
Process
1) Installing perf
Depending on your Linux distribution, the installation method may differ.
On Ubuntu:
|
1 |
$ sudo apt-get install linux-tools-$(uname -r) linux-tools-generic -y |
On RHEL and its clones:
|
1 |
$ sudo yum install -y perf |
2) Capturing Performance Data
For our example, we’ll be capturing performance data from the mysqld process for 60 seconds.
|
1 |
$ sudo perf record -a -g -F99 -p $(pgrep -x mysqld) -- sleep 60; |
In this command:
- The
-aflag allows us to capture data across all CPU cores. -gfacilitates call-graph (or stack trace) recording in both user and kernel spaces.- With
-F99, we’re instructingperfto sample data 99 times every second.
3) Converting Captured Data
Once data is captured, it’s initially in a binary format. To make sense of this data, we need to convert it into something more readable.
|
1 |
$ sudo perf script > perf.script |
Although it’s now in a human-readable format, visualizing this data in the form of a Flame Graph is ideal to truly glean insights with ease.
4) Installing the FlameGraph Toolkit
We need the FlameGraph toolkit by Brendan Gregg to create our flame graphs.
|
1 2 3 |
$ mkdir -p ~/src $ cd ~/src $ git clone https://github.com/brendangregg/FlameGraph |
5) Producing the Flame Graph
We can produce our flame graph with the toolkit installed and our performance data ready.
|
1 |
~/src/FlameGraph/stackcollapse-perf.pl perf.script | ~/src/FlameGraph/flamegraph.pl > flamegraph.svg |
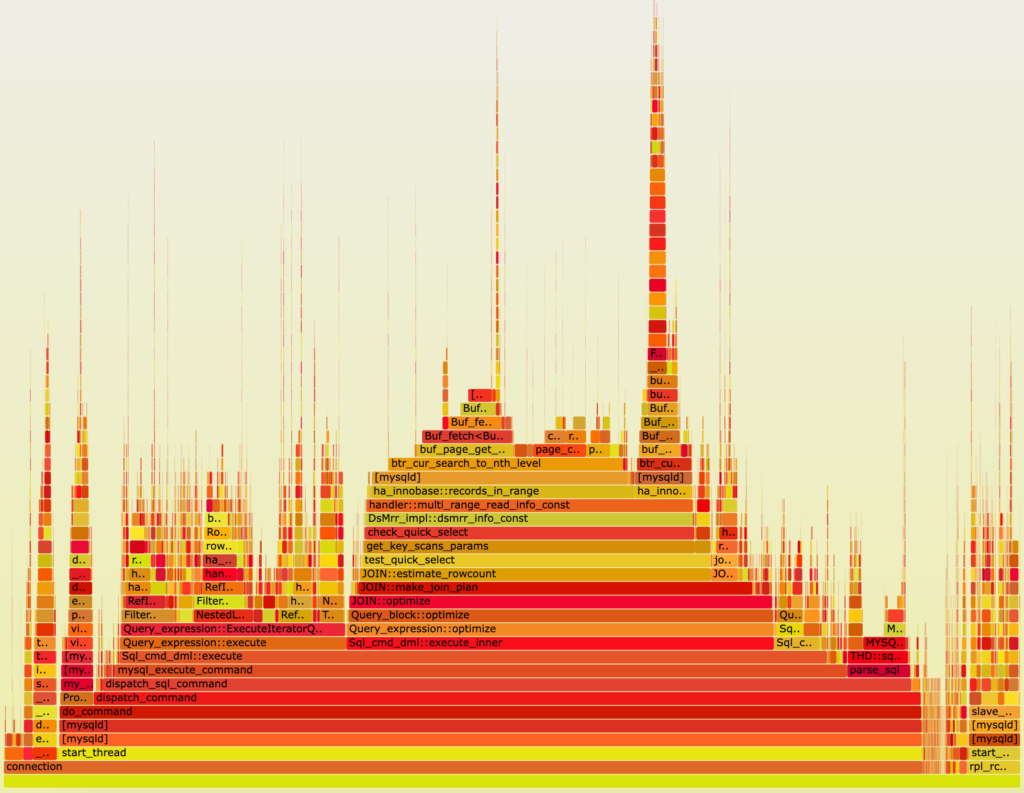
You can now open flamegraph.svg in your preferred web browser to interactively explore the graph. Here is an example of a flame graph (the image is static since WordPress does not allow SVG files):
Further Reading
For those interested in diving deeper into profiling with perf and Flame Graphs:
In Conclusion
Flame graphs provide an invaluable tool for performance analysis. Providing a visual representation of CPU consumption allows developers and system administrators to quickly identify and troubleshoot performance bottlenecks. Using perf in combination with the FlameGraph toolkit makes the process of generating and interpreting these graphs straightforward. Happy profiling!

The floor is yours.
0 comments · Moderated · civil & on-topicFirst comment appears here once approved. Questions, corrections, and counterpoints welcome — just no self-promotion.