In this blog post, I will test Dolphie, an open-source project by Charles Thompson. Dolphie is an open-source tool that provides real-time analytics for MySQL, MariaDB, and ProxySQL. As a first-time user, my goal is to go from zero to hero, exploring how easy it is to start using the tool while getting familiar with its key features and statistics.
Installation
Dolphie offers four installation methods: PyPi, Poetry, Brew, and Docker. There’s also a fifth option if you prefer to compile it yourself. Since I’m using a MacBook, I opted for the Brew installation.
My setup is a MacBook M3 running macOS Sequoia 15.1. Installation is straightforward:
|
1 |
$ brew install dolphie |
After installation, you can check the version:
|
1 2 |
$ dolphie --version 6.5.3 |
The help menu is very comprehensive:
|
1 2 3 4 5 6 7 8 9 |
$ dolphie --help usage: dolphie [--help] [--tab-setup] [-C ] [-u ] [-p ] [-h ] [-P ] [-S ] [-c ] [-m ] [-l ] [-r ] [--host-cache-file ] [--tab-setup-file ] [--heartbeat-table ] [--ssl-mode ] [--ssl-ca ] [--ssl-cert ] [--ssl-key ] [--panels ] [--graph-marker ] [--pypi-repo ] [-H ] [-R] [-D] [--daemon-log-file ] [--replay-file ] [--replay-dir ] [--replay-retention-hours ] [--exclude-notify-vars ] [--show-trxs-only] [--additional-columns] [--debug-options] [-V] [uri] Dolphie, an intuitive feature-rich top tool for monitoring MySQL in real time [...] |
Testing
To test Dolphie, I configured MySQL using Docker. This was a standard installation with no customizations:
|
1 |
$ docker run -d -p 3306:3306 -it -e MYSQL_ROOT_PASSWORD=vinnie --name mysql mysql:8.0.39 |
Verifying the setup:
|
1 2 3 |
$ docker ps CONTAINER ID IMAGE COMMAND CREATED STATUS PORTS NAMES cbe6b8b6d23b mysql:latest "docker-entrypoint.s…" 6 seconds ago Up 5 seconds 0.0.0.0:3306->3306/tcp, 33060/tcp mysql |
To add some workload, I used sysbench:
|
1 2 3 4 5 6 7 8 9 10 11 |
// Prepare the environment $ sysbench --db-driver=mysql --mysql-user=sysbench --mysql-password='sysbench' \ --mysql-port=3306 --mysql-host=127.0.0.1 --mysql-db=test --range_size=100 \ --table_size=10000 --tables=5 --threads=5 --events=0 --time=60 \ --rand-type=uniform /usr/share/sysbench/oltp_read_only.lua --mysql_storage_engine=InnoDB prepare // Running the synthetic workload sysbench --db-driver=mysql --mysql-user=sysbench --mysql-password=sysbench \ --mysql-port=3306 --mysql-host=127.0.0.1 --mysql-db=test --range_size=100 \ --table_size=10000 --tables=5 --threads=1 --events=0 --time=6000 \ --rand-type=uniform /usr/share/sysbench/oltp_read_write.lua --db-ps-mode=auto --report-interval=1 run |
To connect to MySQL with Dolphie, I used the command line:
|
1 |
$ dolphie -h 127.0.0.1 -u root -pvinnie |
My Impressions
When Dolphie runs on the same host as the MySQL database, it’s possible to visualize OS metrics. In my case, since everything is running on my laptop, I used the loopback address to monitor OS resources. Here’s how the overall interface looks:

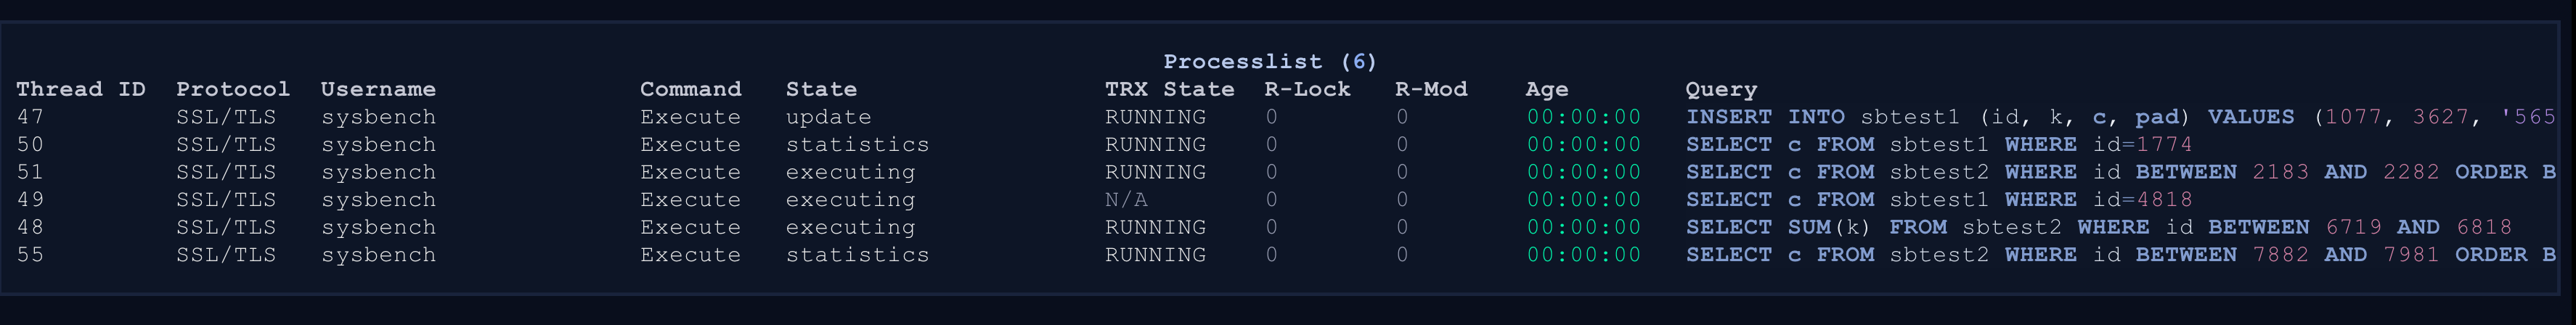
And here are the queries displayed below:
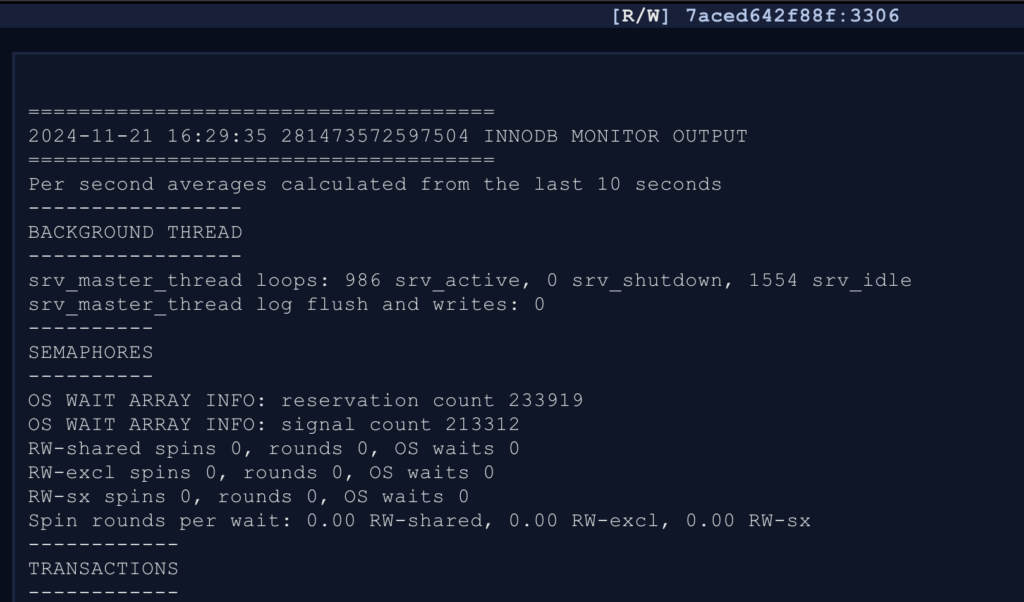
Dolphie has many advanced features. Pressing ? displays an extensive list of commands. For example, pressing o reveals the SHOW ENGINE INNODB STATUS (SEIS):
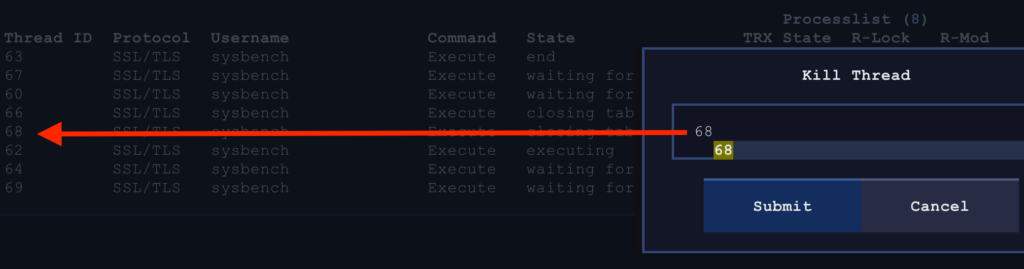
You can even kill a MySQL thread directly from Dolphie:
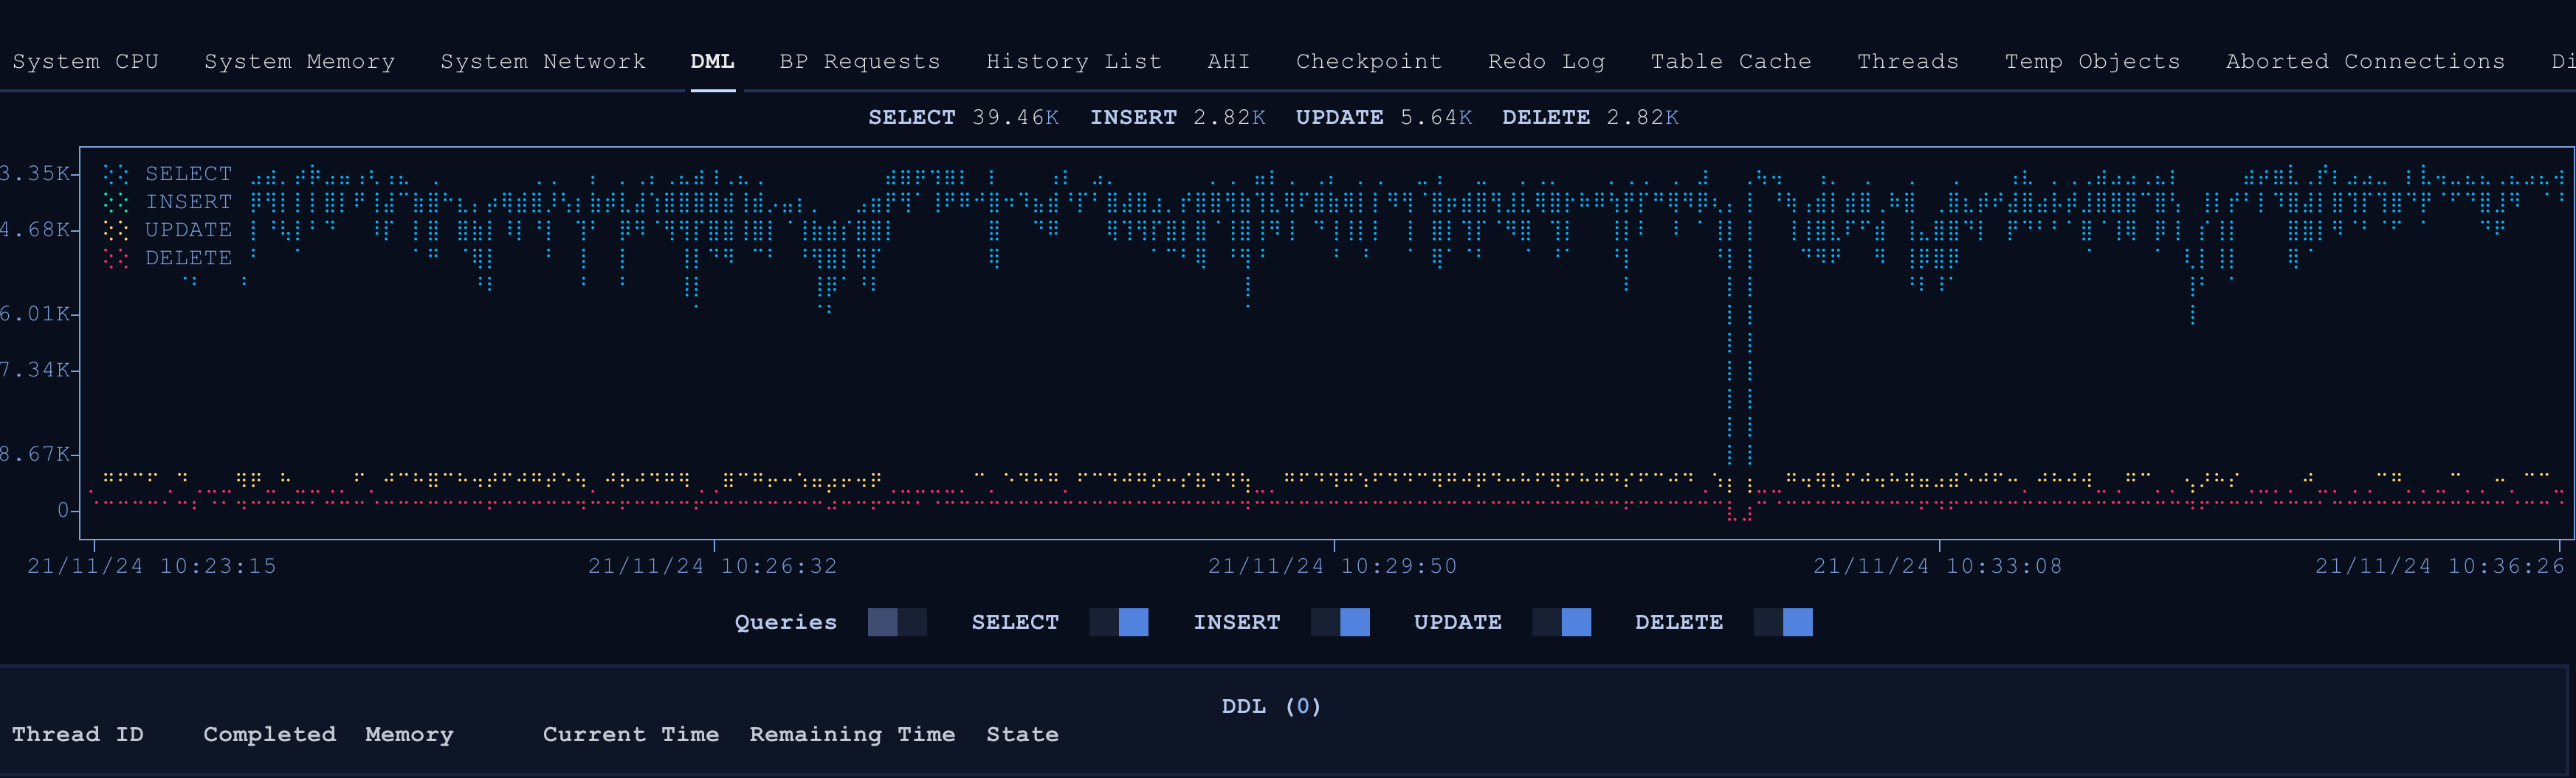
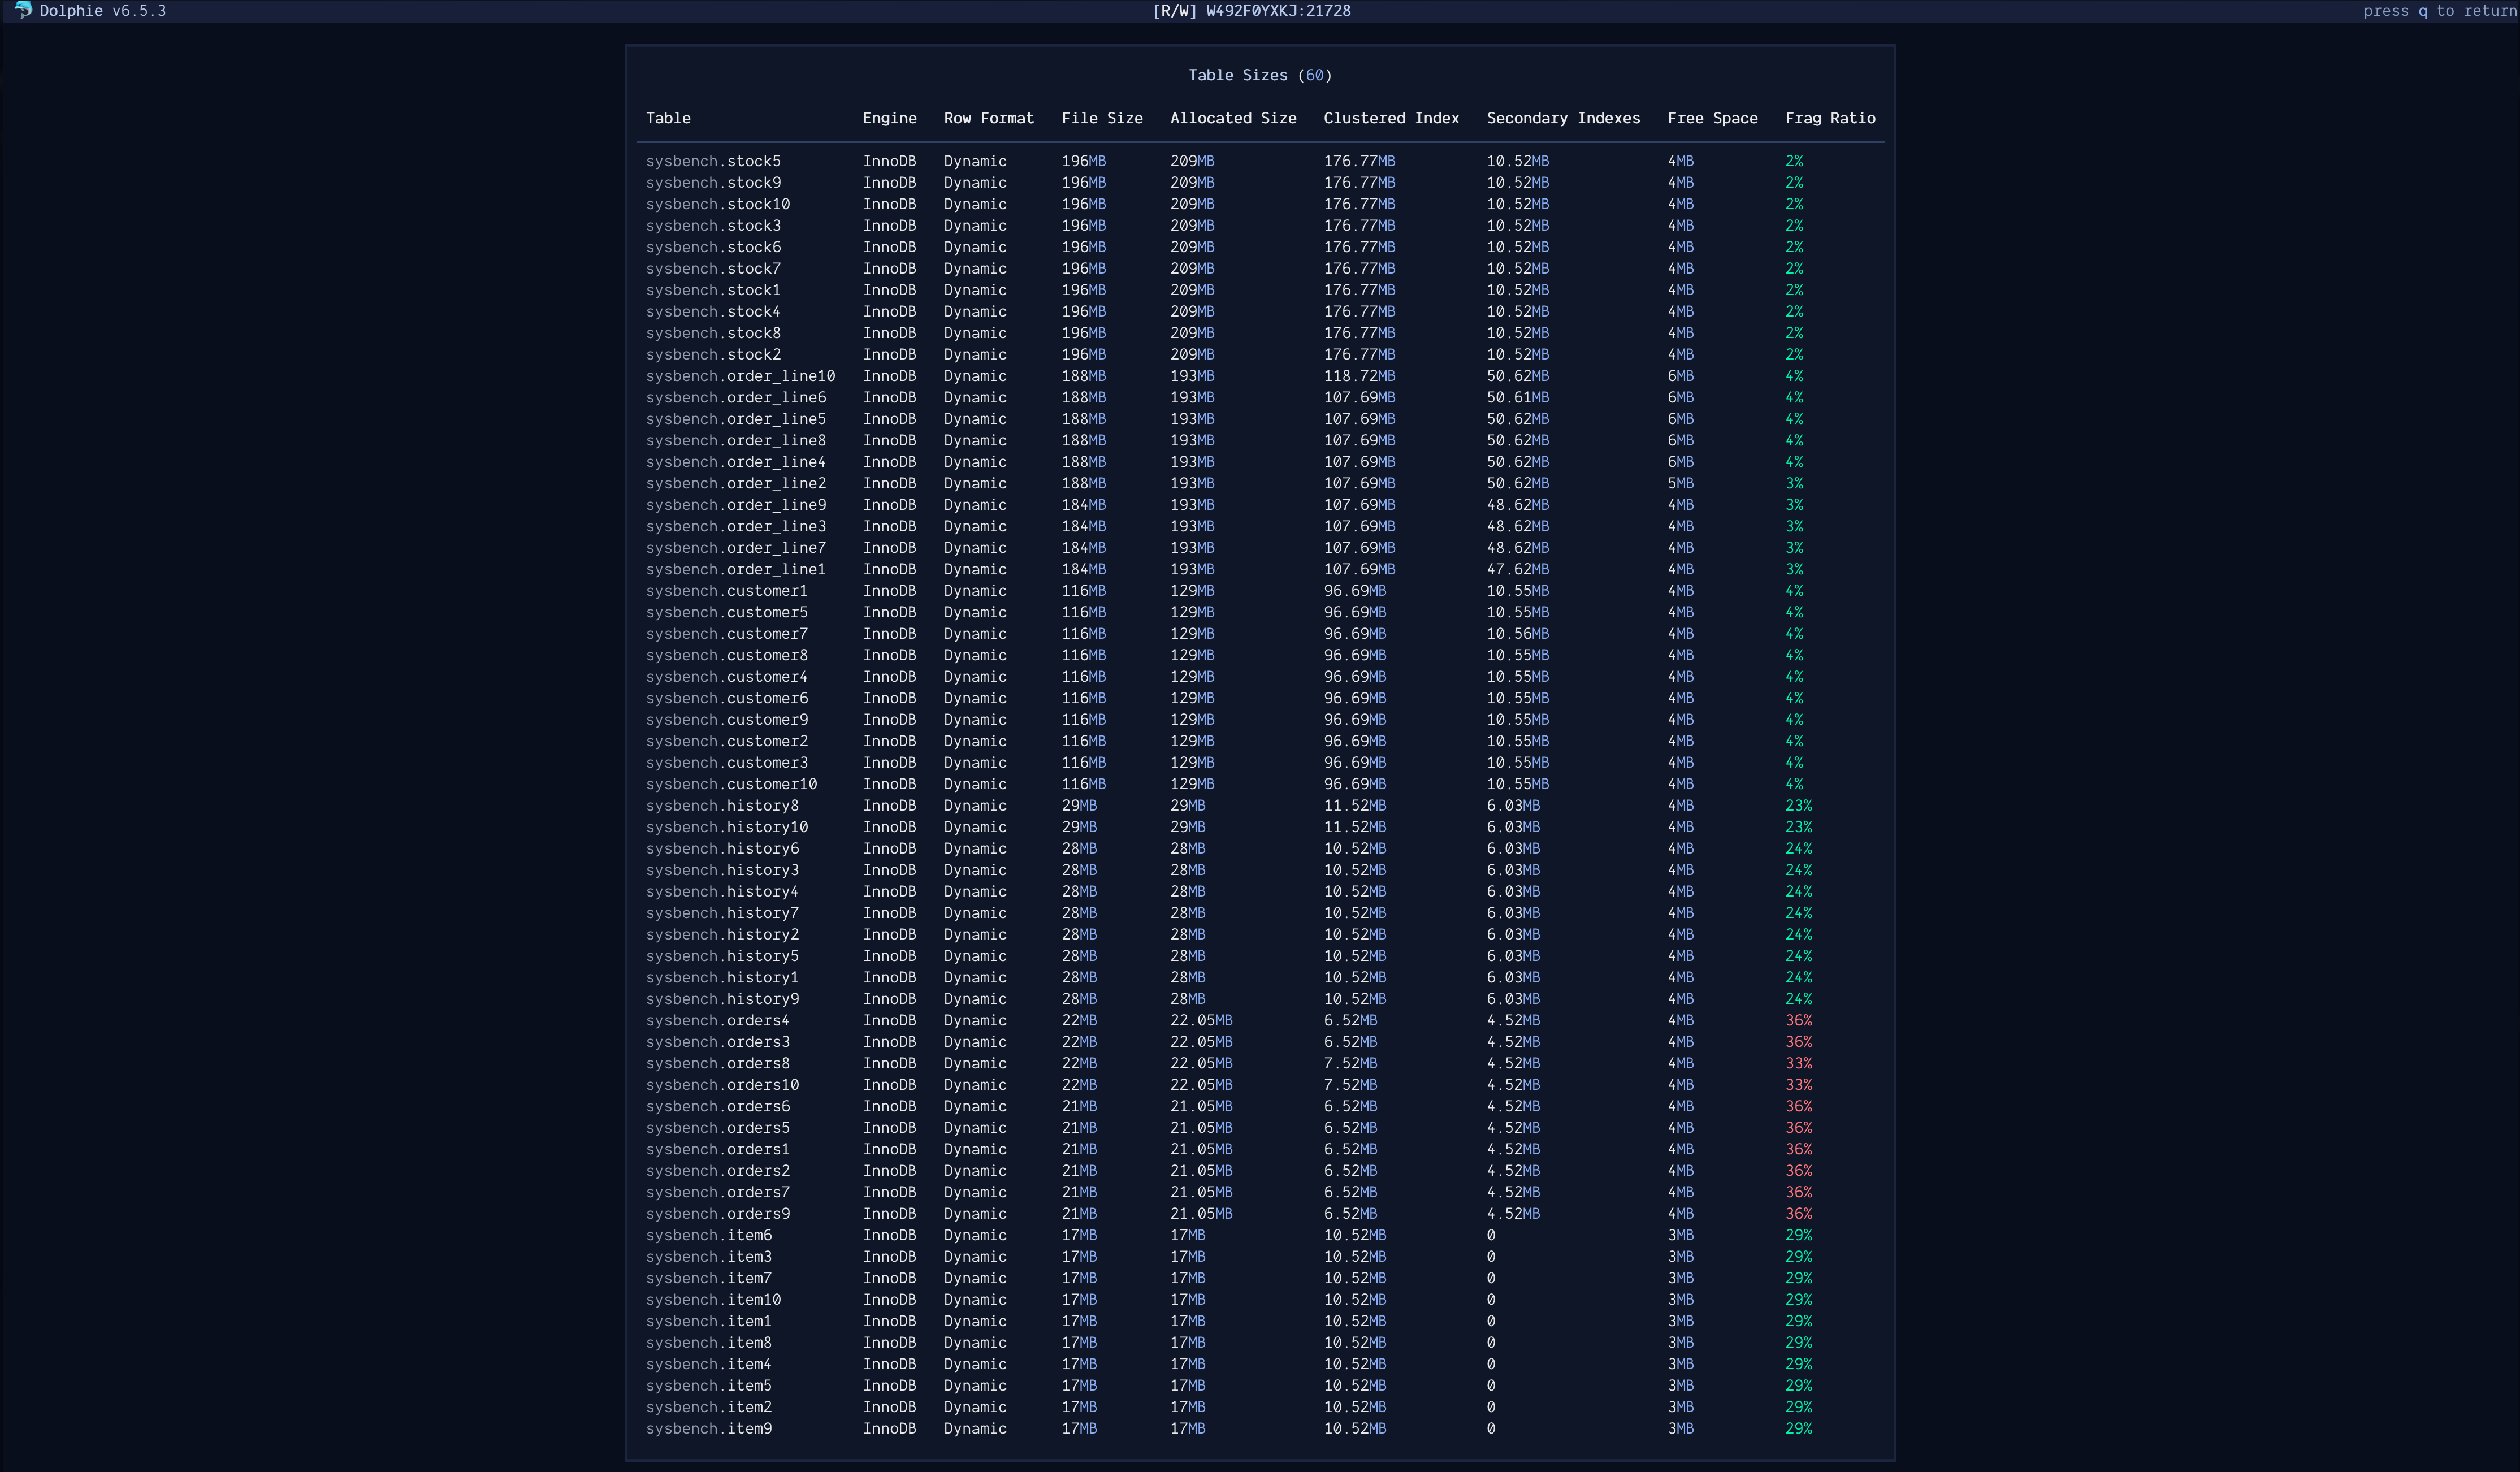
One of the most interesting features for me is the ability to enable graph metrics panels. These visualizations are impressive:
I could spend hours exploring Dolphie’s features, but I’ll leave some for you to discover. From what I’ve experienced, Dolphie is highly customizable. It’s not just a visualization tool; it also allows database interactions, such as killing connections. Unfortunately, I didn’t get the chance to explore its replication metrics, but I’m curious to see how it performs.
Conclusion and the Future
It’s worth emphasizing that this tool comes from the community and is fully open-source. Charles has put a lot of effort into this project and actively listens to user feedback. The release cadence is impressively fast—this version was released just four days ago!
As proof of his attention to the community (apologies if this was a secret, Charles! 😄), we had a conversation where he shared this insight:
More features are on the way! If I had a wish for Dolphie, I’d love to see the ability to modify dynamic parameters. Coupled with the existing metrics panels, this feature would let users monitor changes in real-time, enabling better performance decisions.
Additional Resources
If you’re interested in learning more about Dolphie, check out this insightful blog post by Frederic Descamps – Welcome to Dolphie
Thanks for all your hard work, Charles! Long live Dolphie!

The floor is yours.
0 comments · Moderated · civil & on-topicFirst comment appears here once approved. Questions, corrections, and counterpoints welcome — just no self-promotion.